

Working with distributed systems is usually not an easy thing to do, as with anything, things can go wrong and understanding why becomes a challenge.
What has helped me a ton with Apache Kafka is understanding a bit of the internals, in this series of posts I will introduce the basics and how you can use it when things do not go as expected.
Note, some experience and baggage with Apache Kafka might be required to properly follow this series as we will use some terminology as granted.
If you find it challenging, I can highly recommend The Kafka Definitive Guide book (freely available from the Confluent website) and the amazing Kafka Training by Stephane Maarek at udemy (payment required).
A dissection exercise
As already introduced Apache Kafka is a highly distributed system with many moving parts.
Let's see how a simple deployment looks like
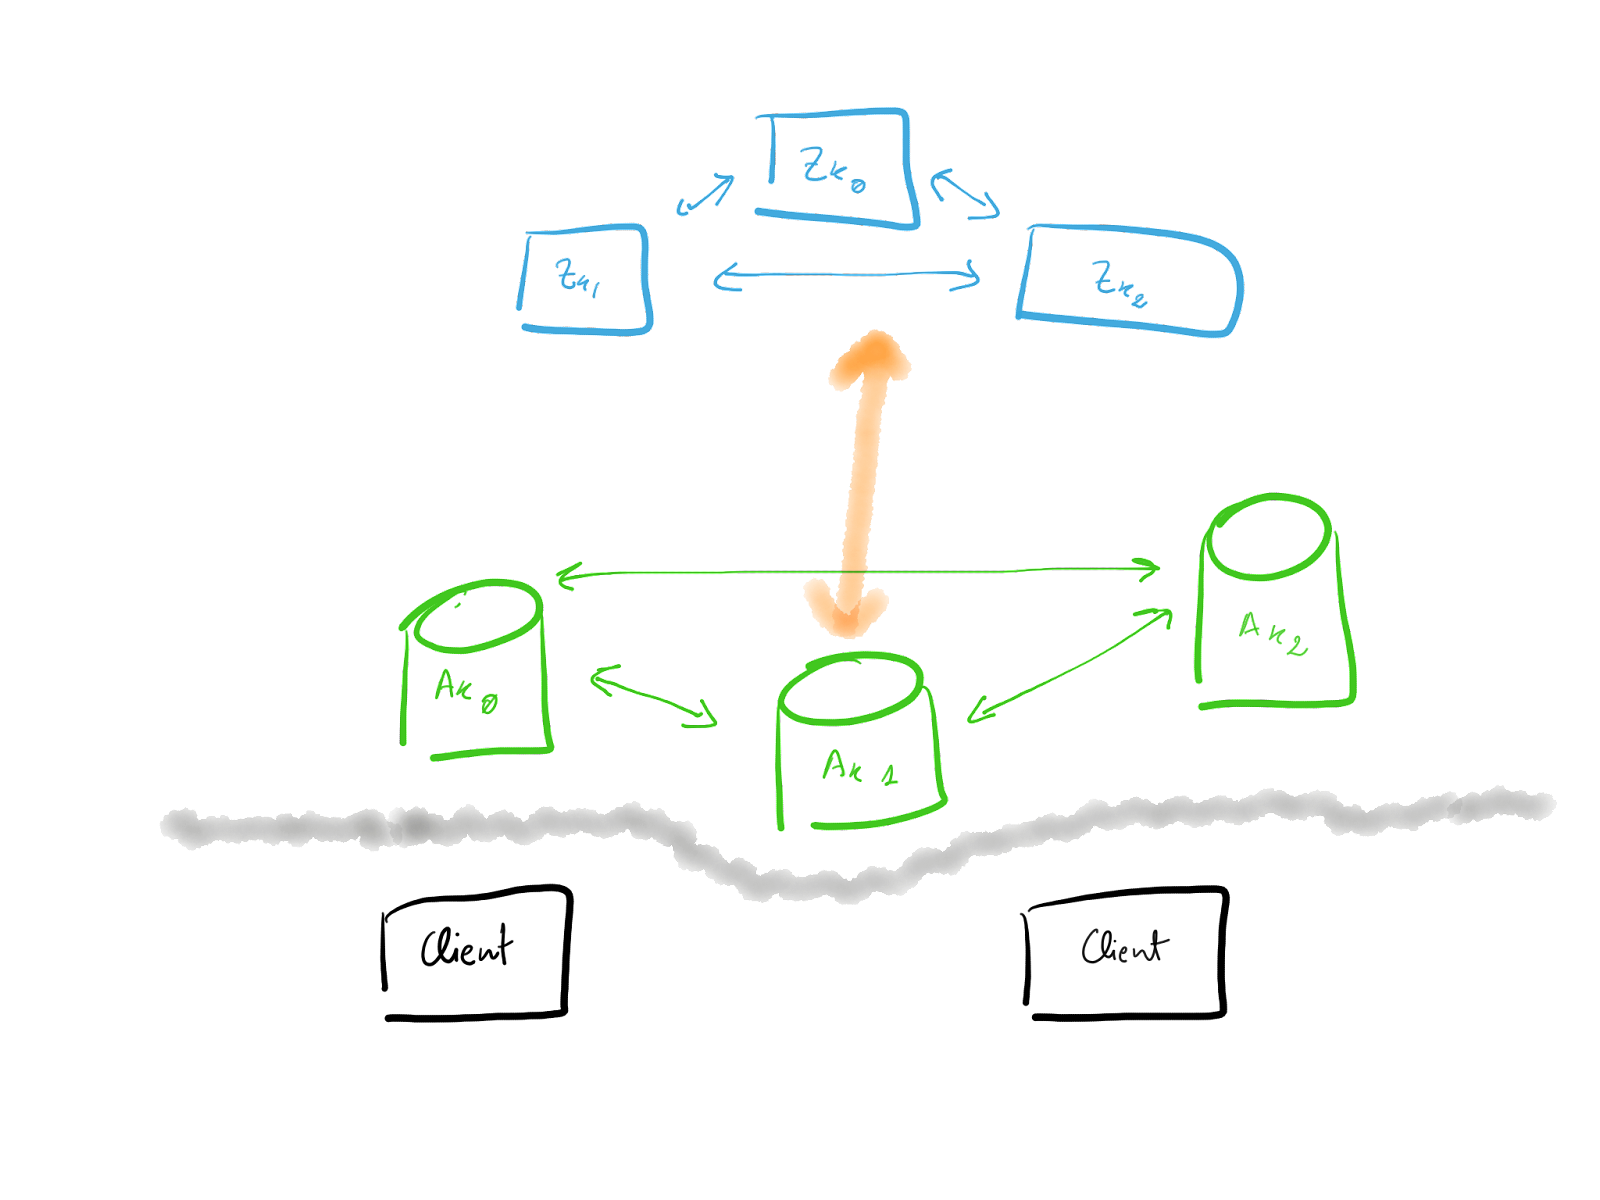
The complexity you can already see, clients that talk to Kafka nodes, Kafka nodes that talk to each other and as well with Zookeeper, and by the way, Zookeeper forms another cluster on its own.
So how to focus when things do not go as expected, narrow down the scope and start from there. In this series, we will focus on the Kafka nodes and their clients as they will be the most usual offenders.
Inside an Apache Kafka node
What is the main responsibility of an Apache Kafka node? In a nutshell, storing and serving the content is stored in a partition. Yes, a node is doing a bit more, but for the purpose of this series, we will simplify it as this.
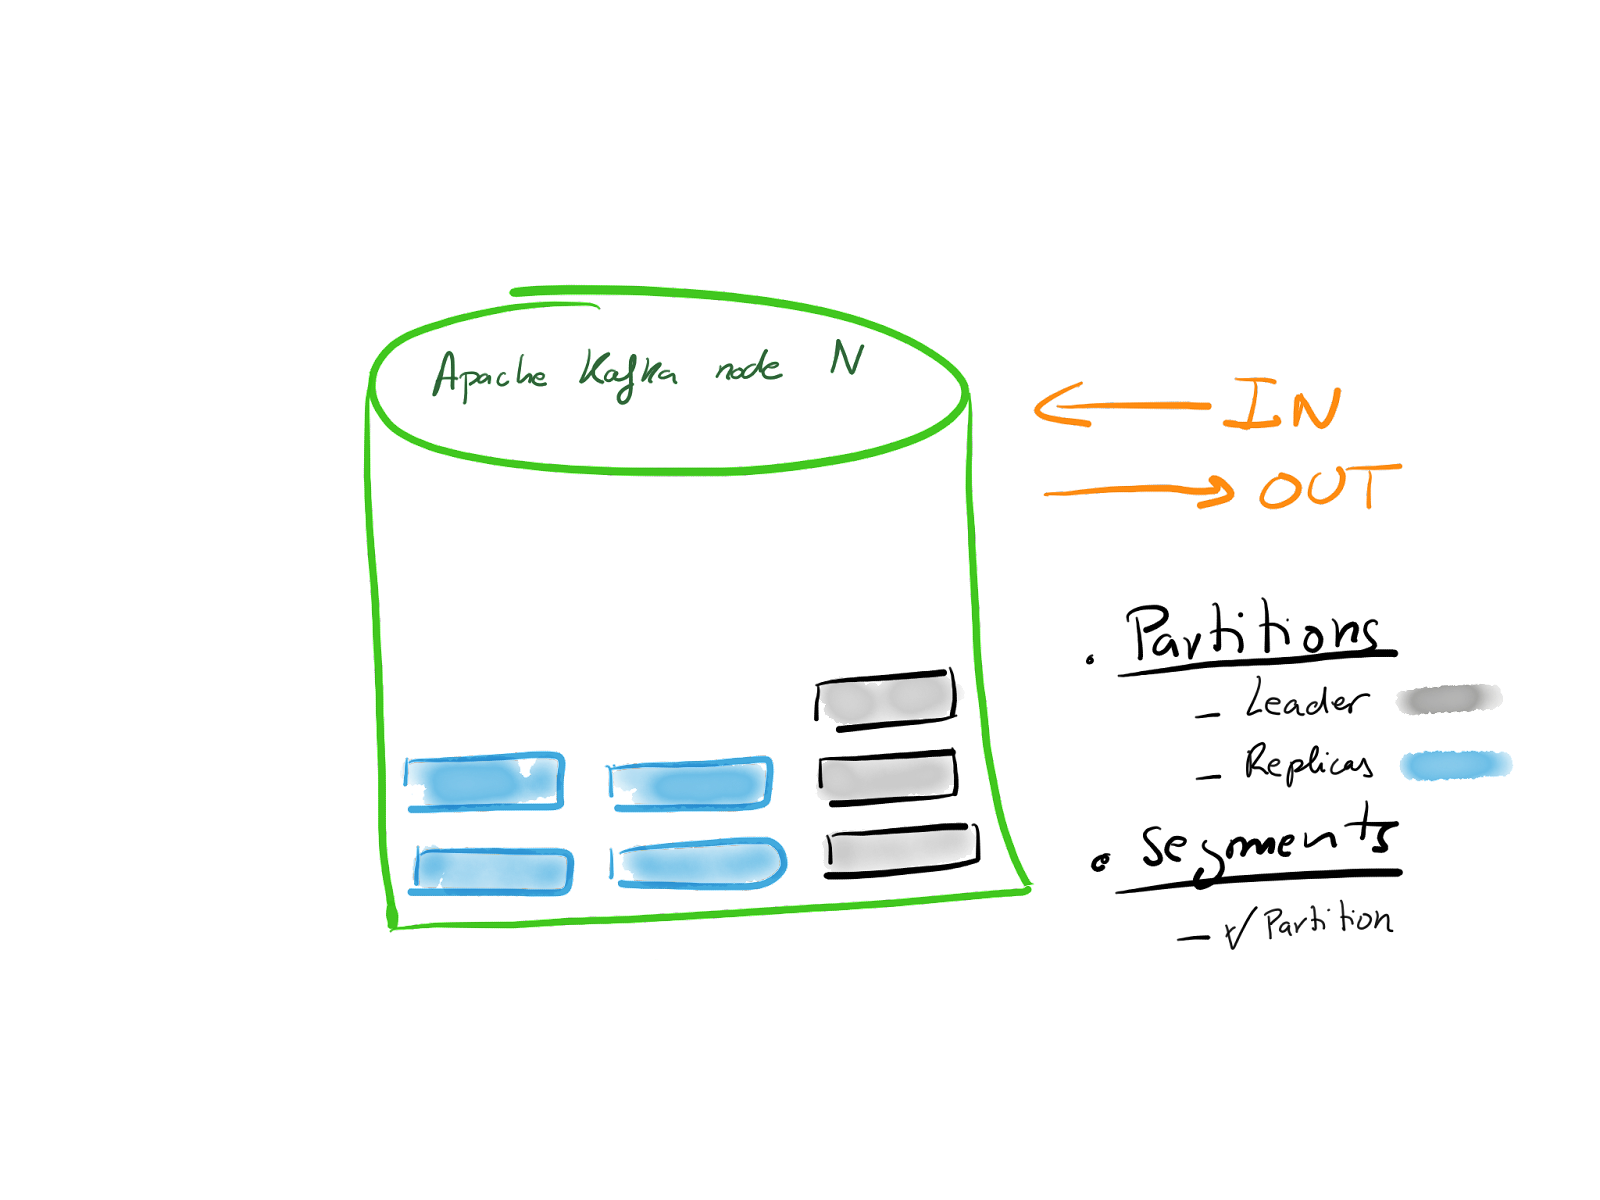
Everyone of your nodes is going to store Partitions, some are going to be the leaders and some will act as replicas. While not relevant to this exercise, but still interesting, note, each partition is stored in segments, by default of 1Gb.
So if a node is basically storing and serving content, how does the pipeline internally in each node looks like? You can see this in the next figure
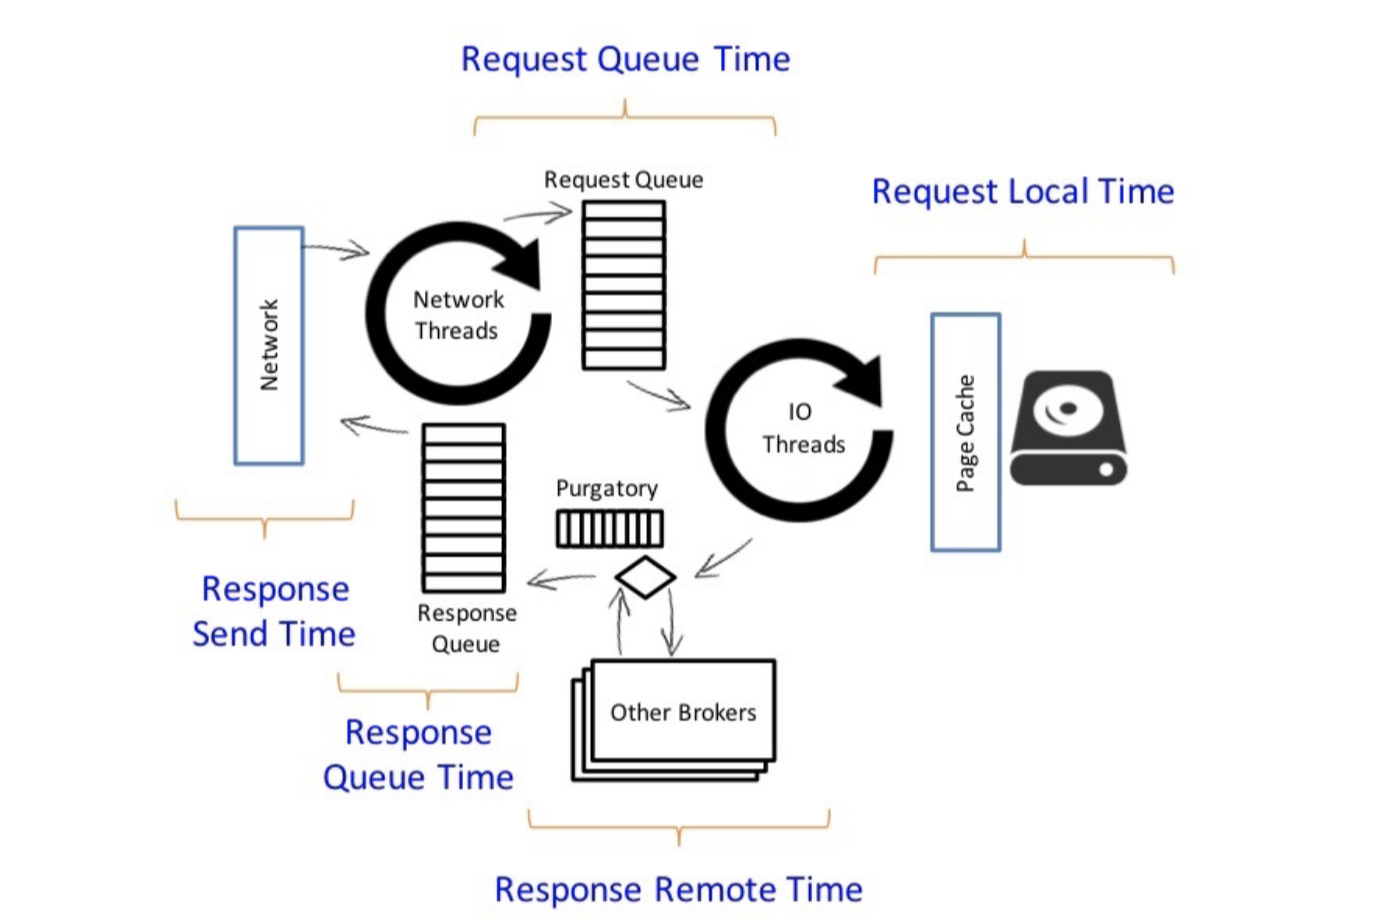
In this picture, you can already see the main components of a node.
When a request, it could be for serving (consumer) or storing (producer) information arrives in a node it is picked by the network threads.
The network threads are a collection of threads, configurable per each node, see the num.network.threads variable. By default, there are three of them.
Once the network threads pick up the request, they store it in the Request Queue. This is an intermediate queue acting as a bridge between the network and the disk.
Another set of threads, the io threads, will pick requests from the Request Queue and interact with the local disks, note, Kafka makes a strong usage of memory mapping (details here and here) to speed up disk IO.
Once the IO work is over, these same threads might put the request in the Purgatory, if it requires waiting for replication (produced with acks=all).
The request might stay in purgatory as long as the replication to other brokers takes place.
As with the network threads, the io threads are configured per broker, using the network.io.threads configuration. By default, there are 8 of them.
The next stage would be the Response Queue, where the request will wait until it is picked up again by the network threads and delivered back to their originator.
So this would be the pipeline all the requests will follow inside a broker, but how this knowledge is going to help you when things do not go as expected? First, we will introduce more details about the requests and the most relevant monitoring metrics.
Requests types
In Apache Kafka you will have three types of requests:
Produce: These are your write requests and are generated by all your clients willing to store information.
FetchConsumer: The request type you will find for all read requests initiated by a client acting as a consumer.
FetchFollower: Last but not least, when a replica is catching up on the latest messages stored in a leader partition, they will issue a FetchFollower request.
Understanding these types is important as they will categorize the behaviour inside the request pipeline. Produce will be for write load while FetchConsumer and FetchFollower will be read.
Monitoring metrics
Once the structure is known, we need to see how we can pull numbers out, so we can understand what might be going on.
If you take a closer look at the figure where the anatomy of a request was shown, you can see some names attached to each section. These are references to monitoring JMX metrics, that keep track of each stage in the pipeline.
In your dashboards, no matter what tool you’re using, for each broker, all of these metrics should be present.
kafka.network:type=RequestMetrics,name=RequestQueueTimeMs,request={Produce|FetchConsumer|FetchFollower}
The time a request spends in the request queue time
kafka.network:type=RequestMetrics,name=LocalTimeMs,request={Produce|FetchConsumer|FetchFollower}
The time the request is processed at the leader.
kafka.network:type=RequestMetrics,name=RemoteTimeMs,request={Produce|FetchConsumer|FetchFollower}
Time the request is spent in purgatory, waiting for replication.
kafka.network:type=RequestMetrics,name=ResponseQueueTimeMs,request={Produce|FetchConsumer|FetchFollower}
Time the request stays in the response queue.
kafka.network:type=RequestMetrics,name=ResponseSendTimeMs,request={Produce|FetchConsumer|FetchFollower}
Network threads time for sending a request out.
A few things to notice from this list.
All metrics have a request type, allowing filtering per specific types.
The sum of all time would be approximately the total time spent by a request in the node.
The local time literally does not only include disks IO, but is a good proxy for that.
There are some related metrics that every Kafka monitoring solution should have,
kafka.network:type=RequestChannel,name=RequestQueueSize
Basically watching out for the size of the request queue
kafka.network:type=RequestChannel,name=ResponseQueueSize
Same, but for the response queue.
And for the side of the threads
kafka.network:type=SocketServer,name=NetworkProcessorAvgIdlePercent
Fraction of the time the network threads are idle. This metric varies from zero (all busy) to one (all idle)
kafka.server:type=KafkaRequestHandlerPool,name=RequestHandlerAvgIdlePercent
The fraction of time the request handlers, aka IO threads, are idle.
Summary
In this entry, we’ve presented the most important building blocks to understand what is going on when a request lands an Apache Kafka broker.
This is certainly a lot of information, so take your time to digest it, certainly the easiest way, at least for me, is to play with it, for example, using docker-compose, you can pull some of the examples from here.
In the next issue of this series, we’ll analyse how to benefit from this information when something goes south.